Backstory
Shortly after I joined the design team at Five & Done, I was asked to put my data science hat back on and dig into some user research we had just completed for one of our clients in the automotive industry.
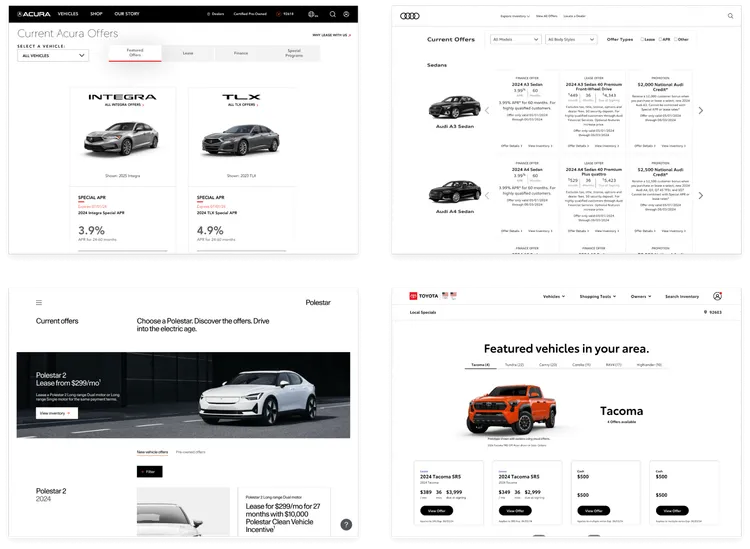
We’re constantly looking for ways to improve online car shopping, and one of our areas of expertise is the Special Offers part of the site. This is where an auto brand will advertise regional incentives, finance deals, lease specials, and other promotions.
To improve conversions for our client, our team had to better understand what car shoppers thought of these offers, how well they understood them, and where in their shopping journey they considered them. Armed with tons of caffeine, another designer & myself set out to seek answers (and maybe a few tips for when I eventually buy my first car 👀).
In this post, I’ll share some challenges and lessons we learned on our user research journey.
Survey sorcery
On average, a car shopper takes 100 days from “I should buy a new car” to actually driving off the lot. Well, when you're looking at website analytics, you don’t always know if that shopper is on Day 1 or Day 100 of their journey to new car ownership. Our team needed to understand more about intent at different stages of the shopping and decision-making process. We also needed a statistically significant data set. User testing would be too anecdotal at this stage.
We needed to go breadth-first.
This is why we kicked off with an industry-wide online quantitative survey. We cast a wide enough net to collect data points from 500 recent car shoppers & purchasers, and then manually performed cross-analysis on the Qualtrics platform (as a former data scientist in big tech, I nerded out here). So! Much! Data!
This method served our purpose, which was to understand general roadblocks in the shopping funnel. We also found it to be an efficient way to gather statistically significant answers, such as discovering that 60% of customers shop with a ‘vehicle-first’ mindset and use OEM websites mainly to understand which models & trims fit their needs.
But that doesn’t mean the survey on its own was the most comprehensive for our research goals.
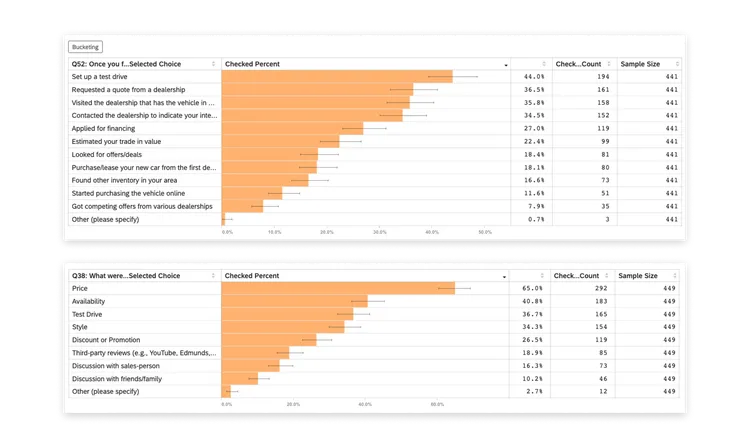
For example, one of the eyebrow-raising stats we gathered from our survey analysis that was relevant to our goal of revamping our client’s offers page was:
The data told us that people cared about price, but also told us they did not care about offers. Unfortunately, that’s all the data told us on this topic. It did not address the reasoning behind the apparent contradiction there. This example actually represents a limitation we discovered with surveys when trying to unravel the mystery behind car shoppers being lost in the sea of car offers. Sure, all of those stats are great. But when you can’t pinpoint the why, there isn’t much to evaluate and consider when designing new screens later on.
This limitation became more obvious when paired with other research challenges we encountered:
Poor response quality: Conflicting survey data, incomplete answers, & ambiguity of answer options all made it difficult for us to identify shopping frustrations and trends.
Recall bias: A good chunk of surveyed shoppers had purchased a new car several months prior, leading to unreliable responses without knowing more about the person.
Lack of user familiarity: Several shoppers may not understand how offers are applied to a car purchase and their final payment.
So at the end of the day, while we surfaced what some pain points were and how many shoppers experienced them, we still didn’t fully understand shopper habits and motivations…
…which brings me to my next point.
Context matters
As a next step, our team conducted remote moderated 1-1 user interviews to dive deeper into the survey data we found interesting, such as the one pointed out earlier. Specifically, we talked to 10 recent purchasers, 5 early-stage shoppers, & 5 late-stage shoppers across the country.
How did we reach this decision?
While the survey was a good way to get insights on how widespread certain problems were, we chose user interviews to explore individual motivations & experiences that numbers alone couldn’t reveal. At the end of the day, car shopping is a niche activity. If we were studying user behaviors in e-commerce, our approach may have been different.
Our decision to continue with this form of qualitative research was fruitful, as we got juicy insights we wouldn’t have otherwise.
Getting to talk to shoppers about the actions they actually took/are taking was a stark contrast to the previous survey responses, in which people indicated what they would do in theory. For example, in our 1-1 interviews, many users stated that during their journey, it was mentally taxing to interpret the information & overall value of online OEM offers amidst an already stressful process. As one of them best put it – “It’s a $50,000 purchase, I’m not just buying shoes!”


